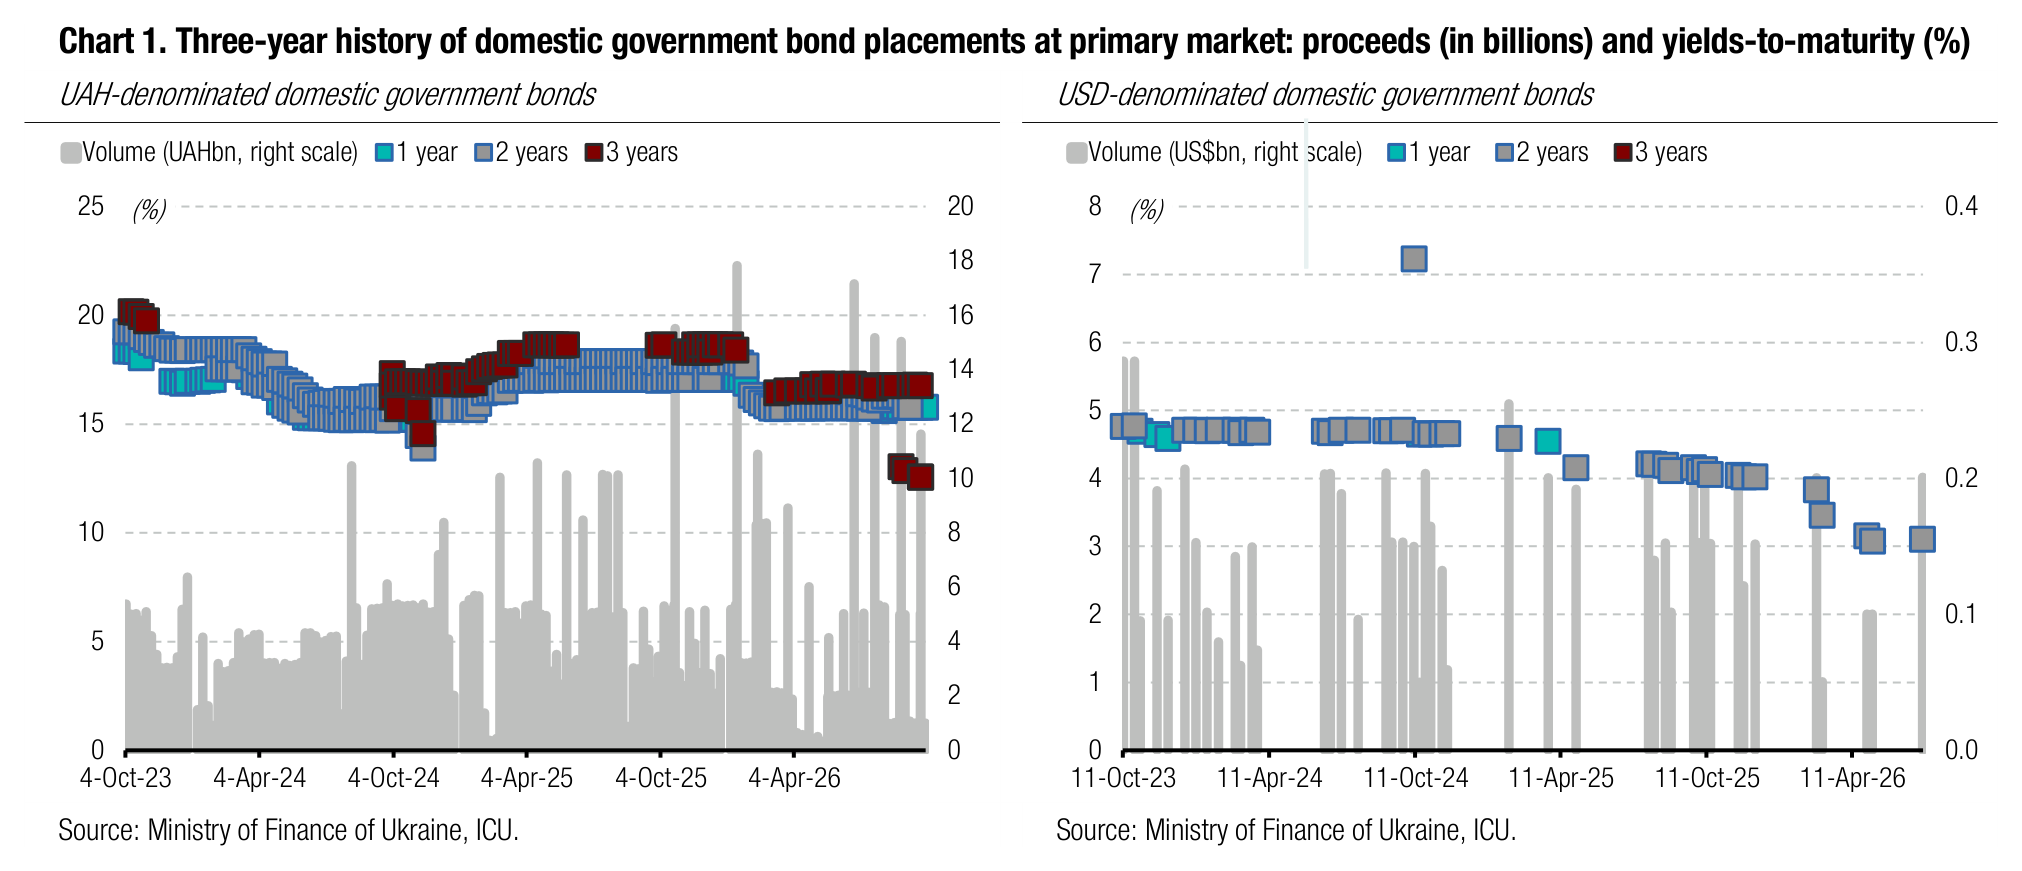

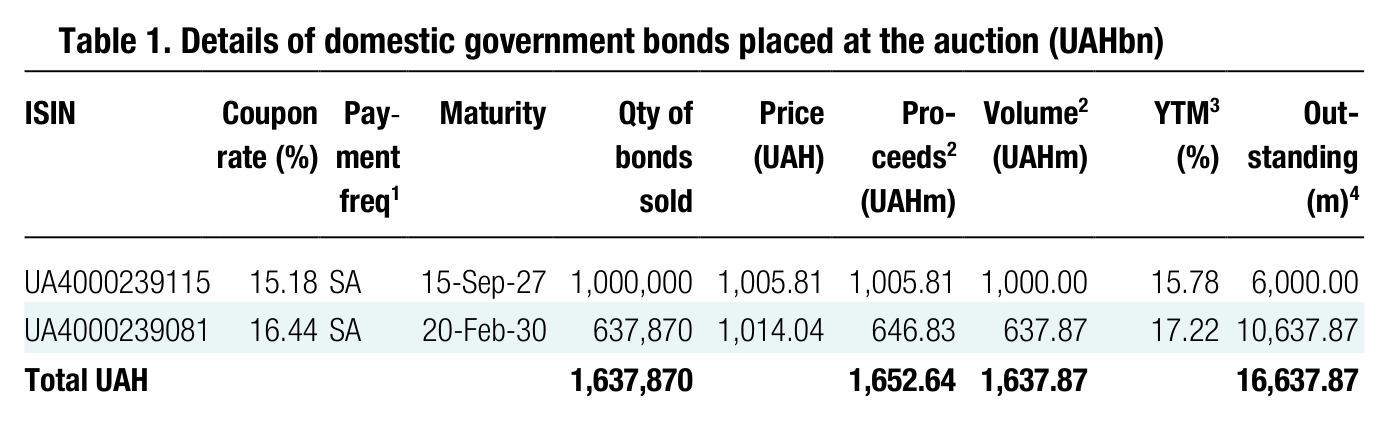
Yesterday, the Ministry of Finance offered only two UAH bonds and raised less than UAH1.7bn, rejecting a significant portion of the demand.
Note: [1] payment frequency abbreviations: M - monthly, Qtly - quarterly, SA - semi-annually, @Mty - at maturity date; [2] proceeds and volumes for the USD-denominated bonds are calculated based on the previous day's exchange rate 44.48/USD, 51.04/EUR; [3] yields on coupon-bearing bonds are effective yields to maturity. Sources: Ministry of Finance of Ukraine, Bloomberg, ICU.
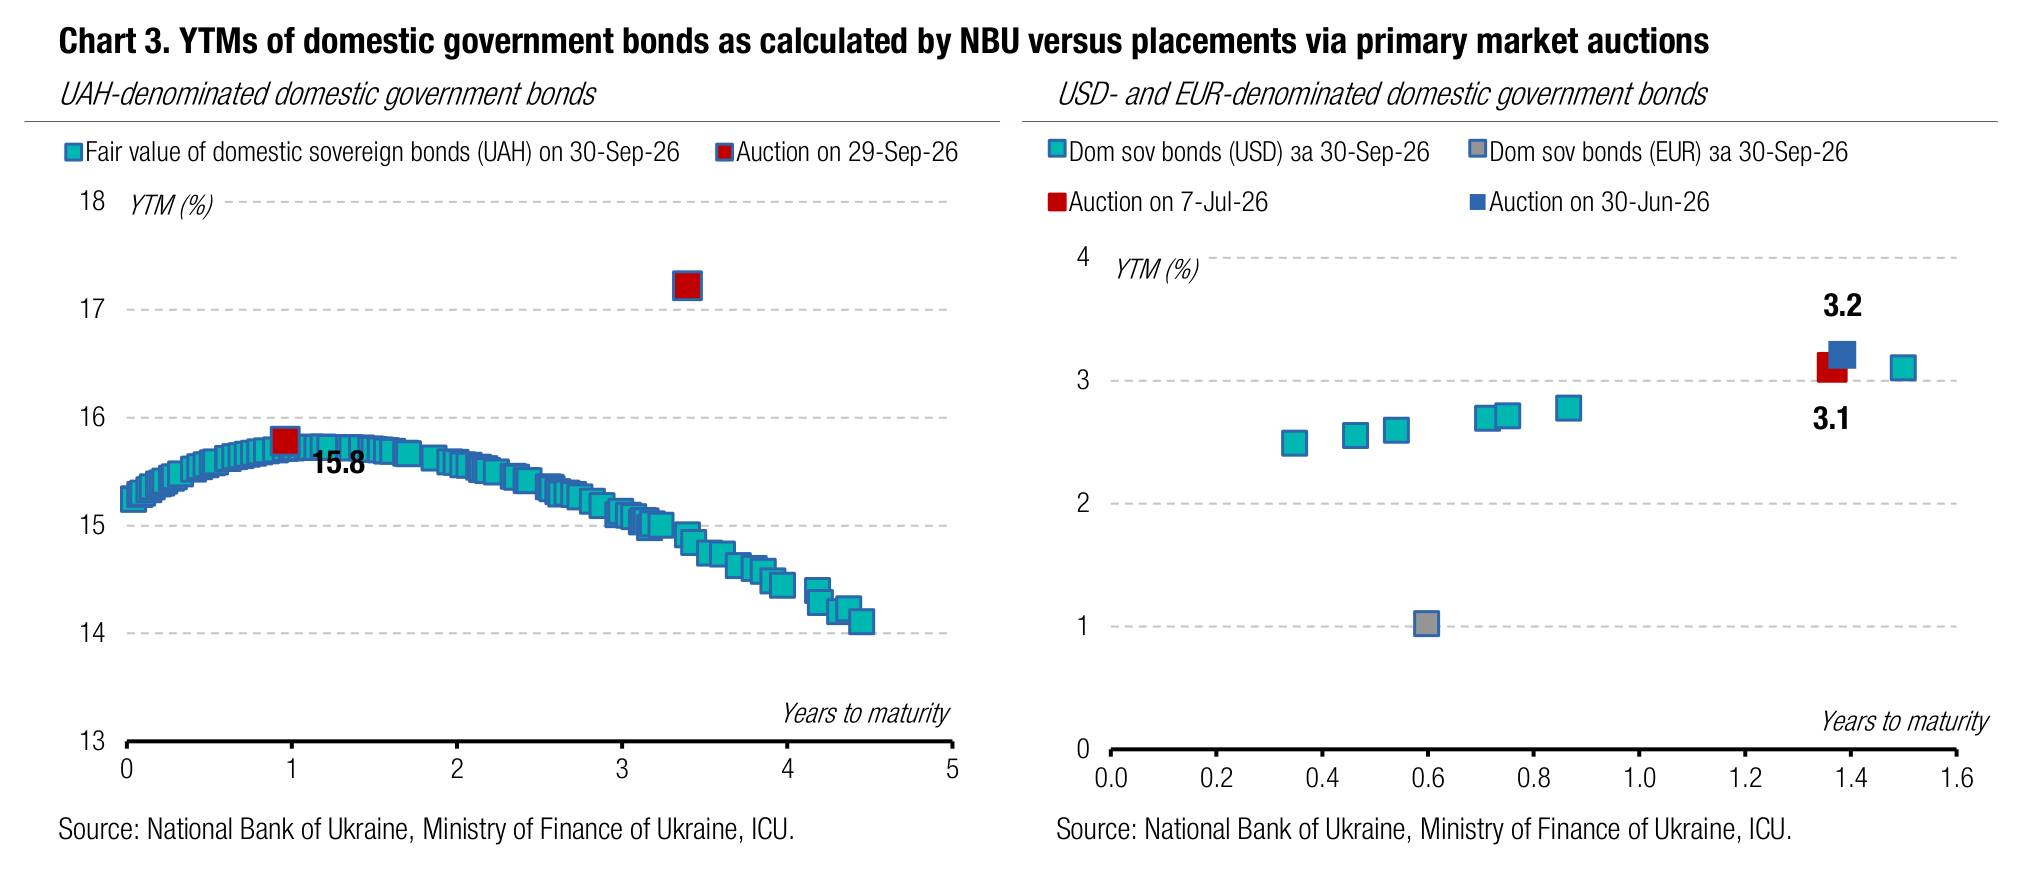
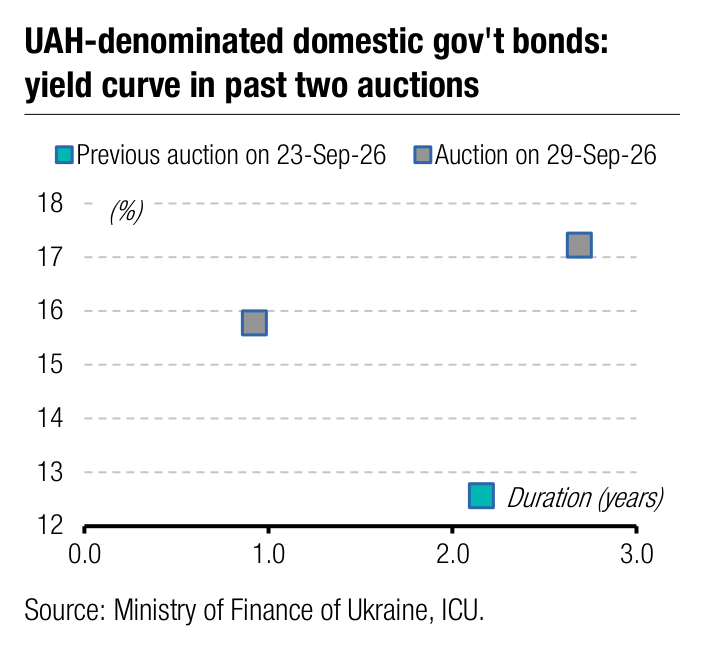
The one-year military paper was offered again with a UAH1bn cap (last week it was UAH2bn), but got a 4x bid-to-cover ratio. Bids ranged from 15.1% to 15.3%; however, competition allowed the ministry to lower the cut-off rate by 1bp to 15.17%, while the weighted average yield remained at 15.16%.
Meanwhile, the 3.5-year note attracted unexpectedly low demand—only UAH0.8bn vs UAH5bn cap. Bid yields approached the cut-off rate from the late-August auction (the ministry issues these bonds only once a month): the minimum bid rose to 16.4%, while the maximum fell to 16.75%. Nevertheless, the MoF decided not to alter the maximum rate and rejected two bids with rates exceeding 16.5%.
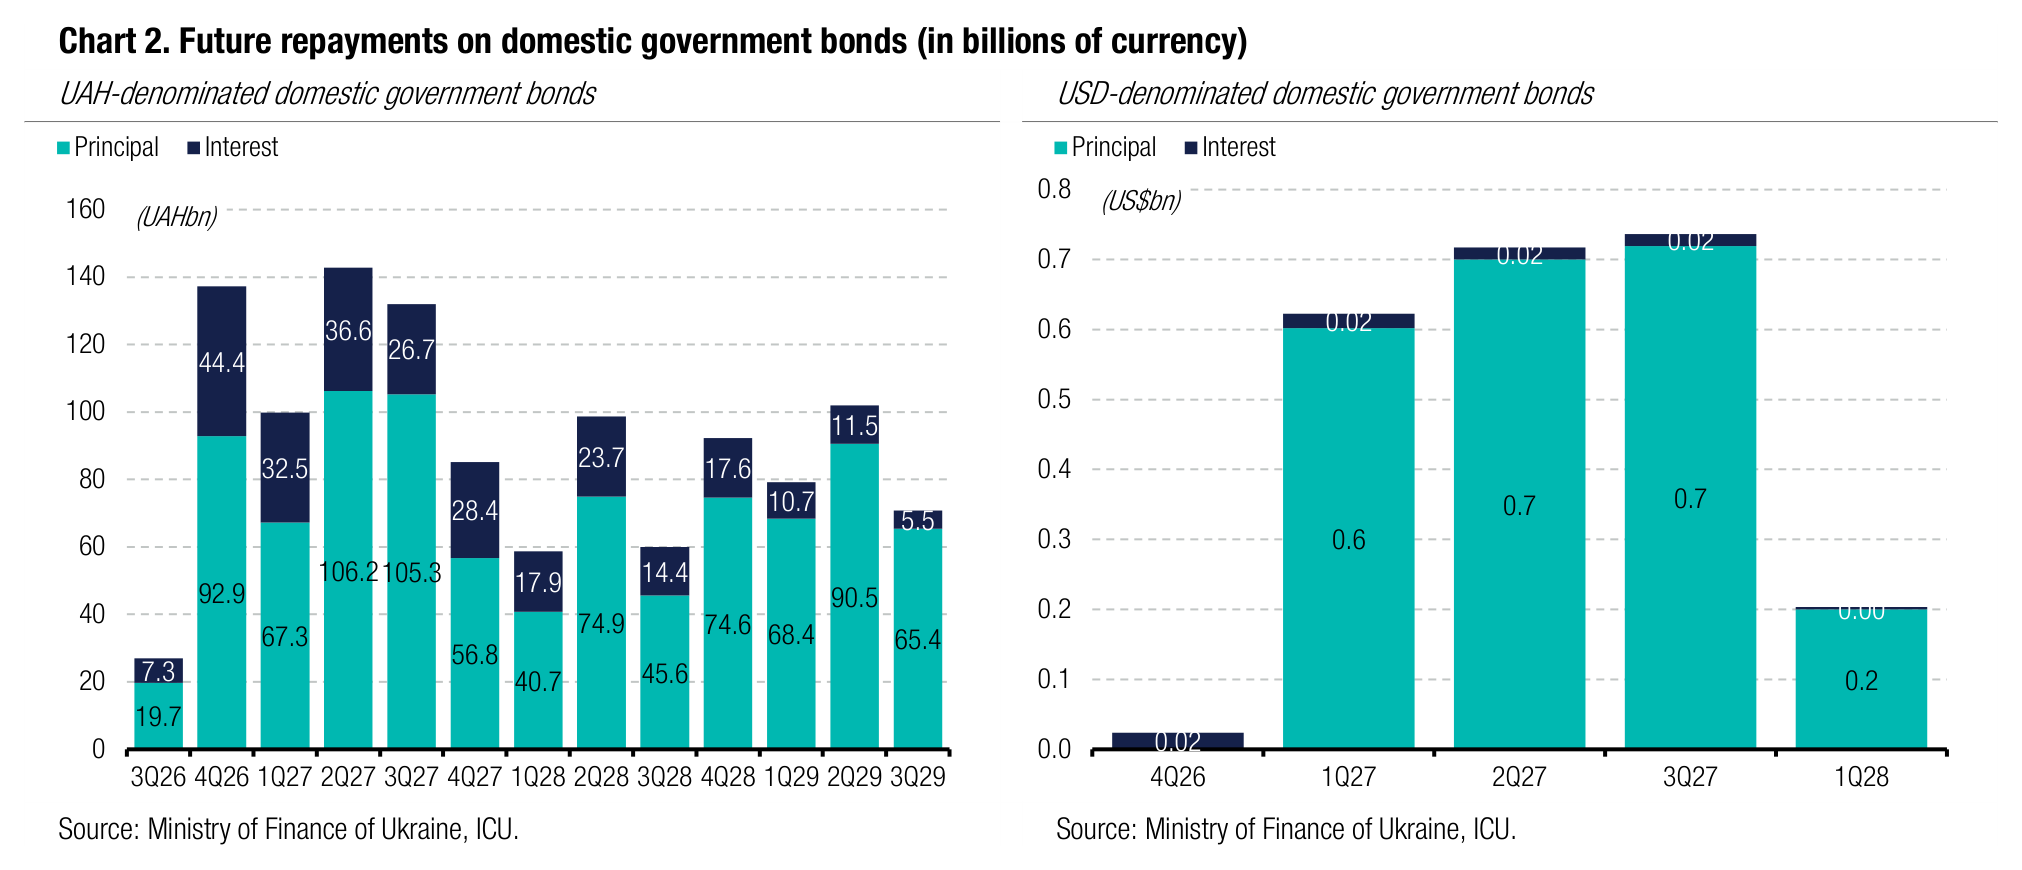
Overall, the Ministry of Finance shows no interest in raising large volumes of funds. Under the current budget plan, UAH57.5bn remains to be raised by year-end, with over a third of this amount expected to come from reserve bonds in October. Thus, given the unchanged need for domestic budget financing, the Ministry of Finance will remain comfortable with raising an average of UAH2bn per week.
Appendix: Yields-to-maturity, repayments