
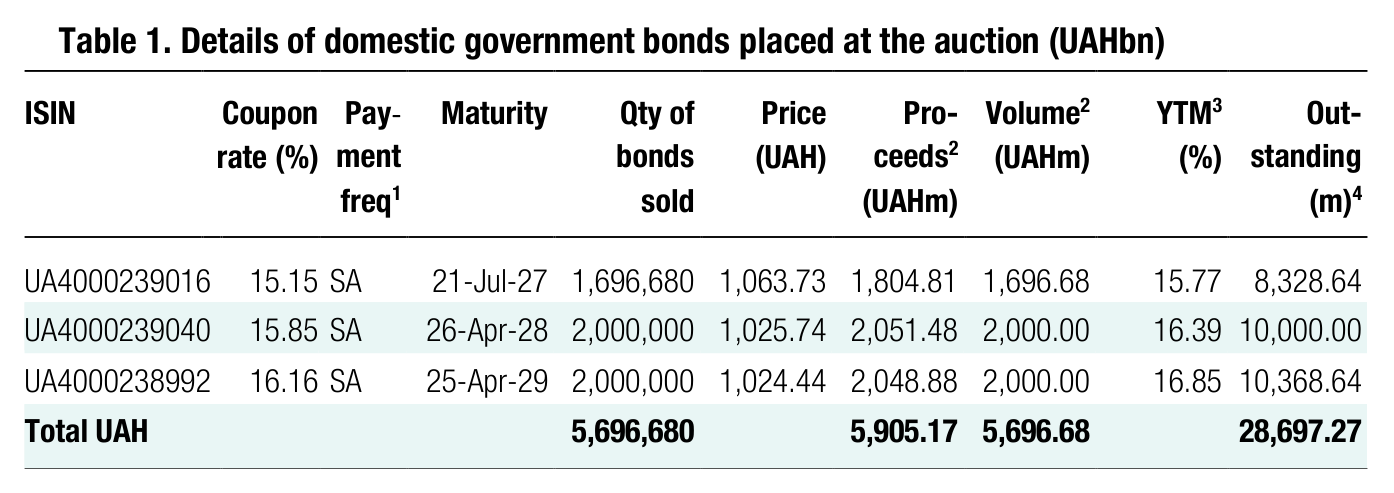
Yesterday, the Ministry of Finance received oversubscription for two of the three offered bonds, although demand for the shortest paper was only slightly undersubscribed.
Note: [1] payment frequency abbreviations: M - monthly, Qtly - quarterly, SA - semi-annually, @Mty - at maturity date; [2] proceeds and volumes for the USD-denominated bonds are calculated based on the previous day's exchange rate 43.95/USD, 51.44/EUR; [3] yields on coupon-bearing bonds are effective yields to maturity. Sources: Ministry of Finance of Ukraine, Bloomberg, ICU.
The 13-month bill received 23 bids for UAH1.7bn vs the UAH2bn cap. All bids were at rates no higher than the cut-off from previous auctions, so the MoF satisfied all bids and raised UAH1.8bn for the budget without changes in rates.
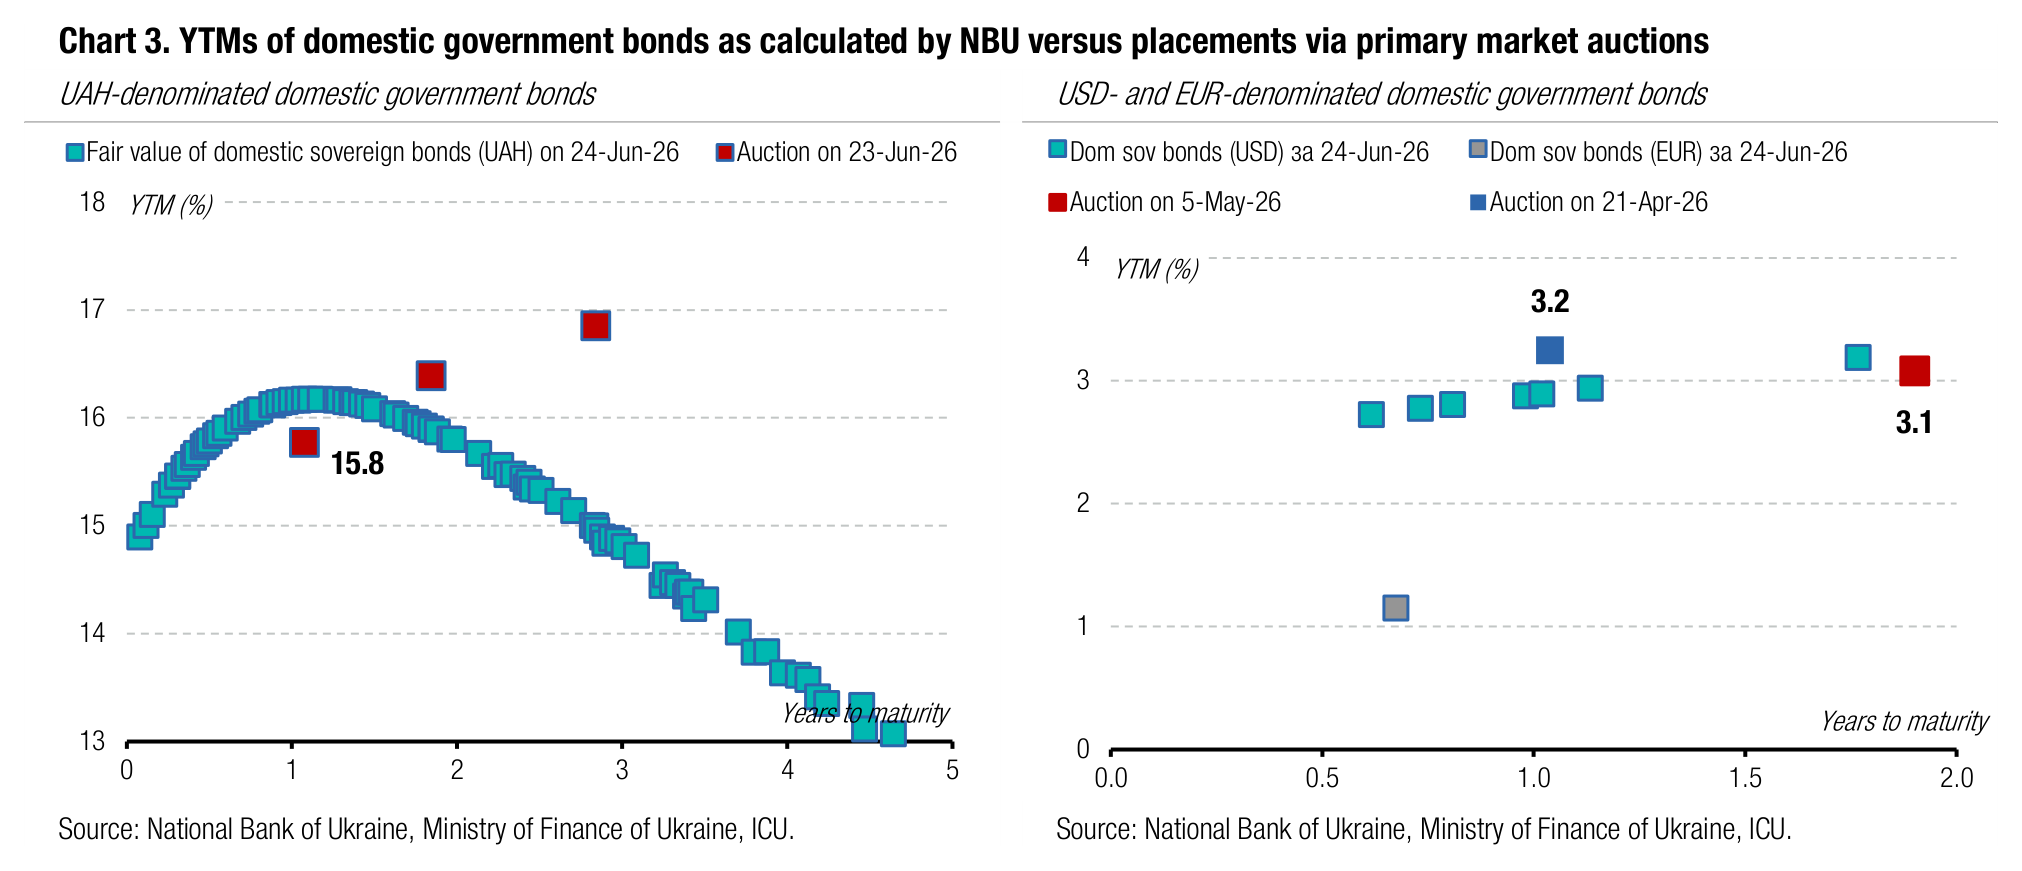
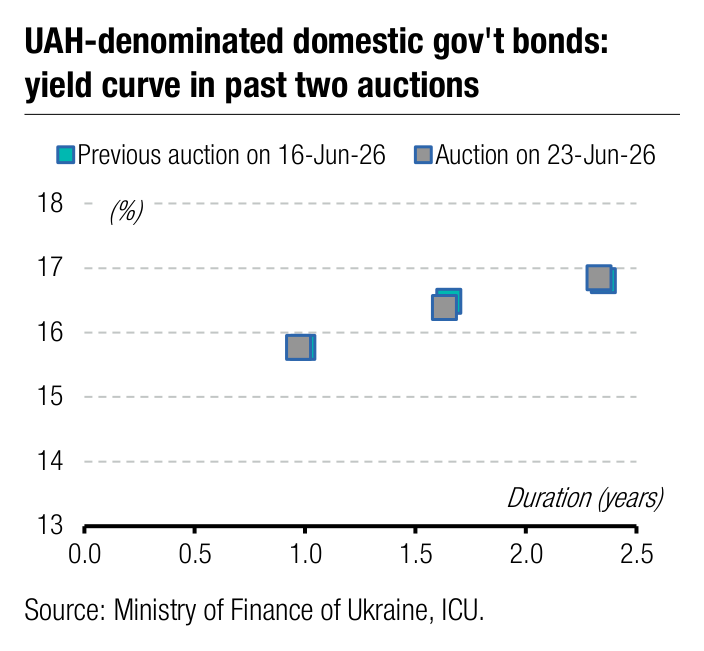
The 1.9-year paper was expected to see much higher demand than the cap. The bid- to-cover ratio reached nearly 2.7x, causing another decrease in yields. The cut-off rate slid by only 1bp to 15.81%, while the weighted average yield declined by 9bp to 15.72%, as the minimum bid rate fell by as much as 21bp to 15.54%. The MoF sold the planned volume of securities, raising a little more than UAH2bn for the budget.
For the first time since the end of March, the three-year note was oversubscribed. A 1.4x bid-to-cover ratio was already a certain surprise. The yields in the bids were not higher than the cut-off level of the previous auction, so the Ministry of Finance satisfied all non-competitive demand and all competitive bids, although not all in full, within the cap.
Such demand was partly a situational response because, before today's redemption, banks and brokers could replenish their stock of such government bonds to serve their clients.
Appendix: Yields-to-maturity, repayments