

Ukrainian bond market
Retail portfolio growth accelerates
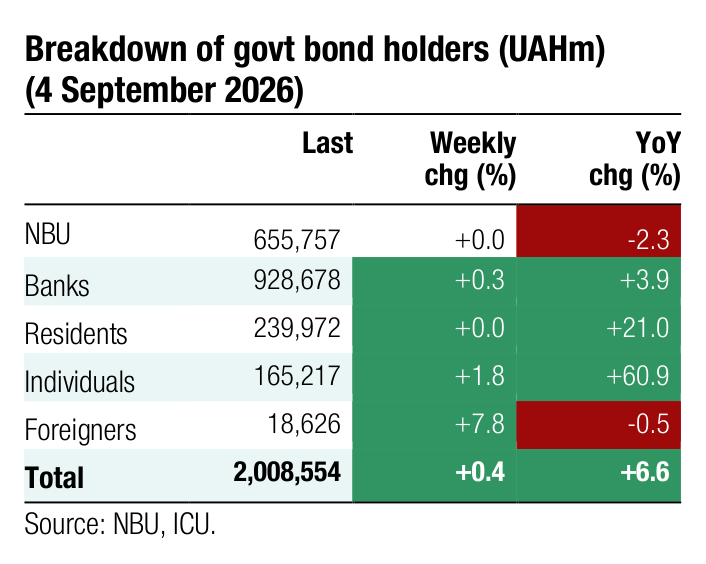
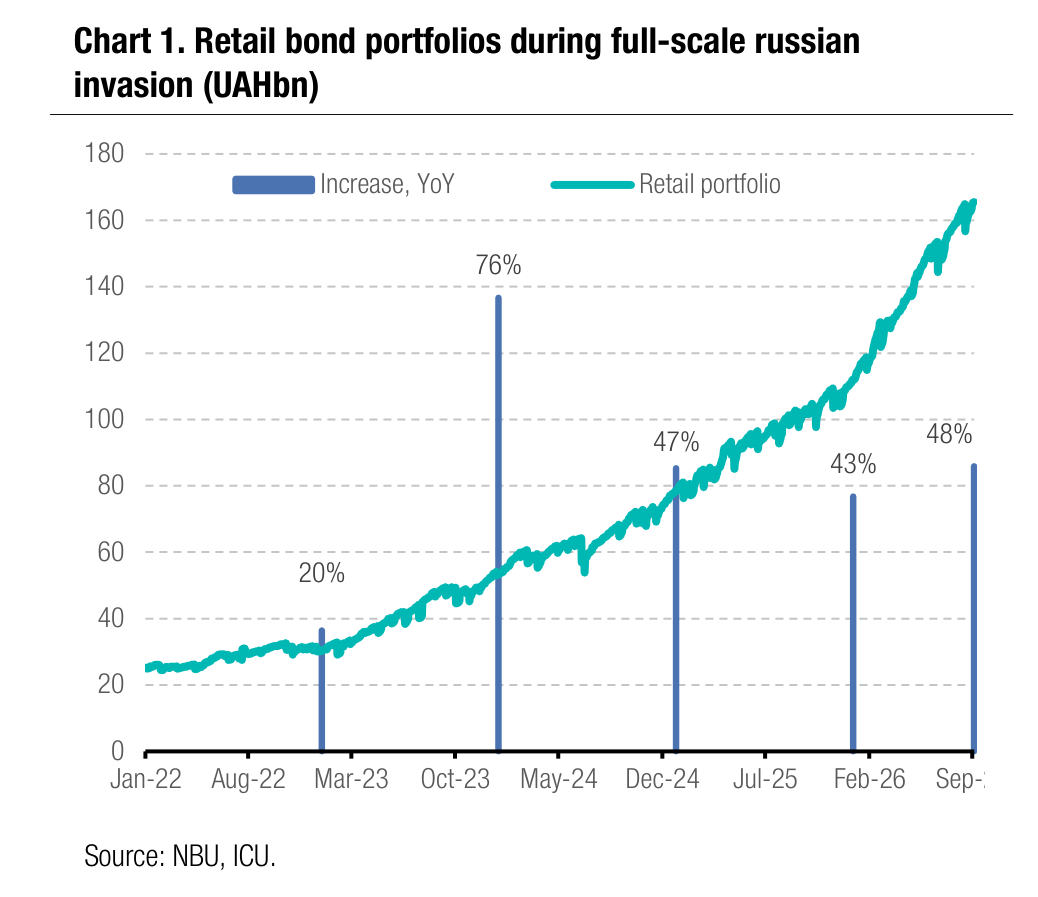
Households are increasing their investments in government bonds at a growing pace, with their total portfolio up 48% YTD.
The growth rate of the households’ bond portfolio YTD exceeds those in two previous years despite a much higher comparison base. The share of UAH-denominated bonds in retail portfolios remains consistently above 60%.
The total volume of the retail portfolio today is over UAH165bn (US$3.7bn), up UAH6bn (4%) MoM. Households' share in the total volume of government bonds outstanding (excluding bonds held by the NBU) exceeds 12%.
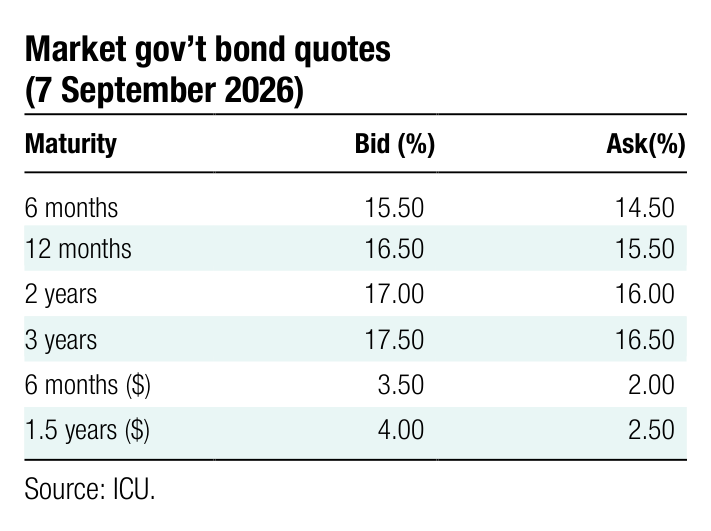
ICU view: High interest rates and the tax-exempt regime for coupons (for retail investors only) make government bonds way more attractive for households compared with deposits. Convenient mobile applications that enable the purchase of government bonds within minutes also drive household's interest in government papers. Retail investors continue to prefer UAH-denominated bonds, but the share of local currency securities has stabilised at 60-62% over the past few months. That implies the demand for USD and Euro-denominated government bonds that help hedge FX risks also remains robust. We expect the Ministry of Finance to keep yields on government bonds in the primary market little changed at least until the end of September. However, a likely hike in the NBU key policy rate in mid-September and a possible increase in domestic borrowing plans following state budget revisions may force the MoF to adjust rates up in 4Q26.
Investors thirsty for more reasons for optimism
This weekend, the US attempted to revive negotiations to end the war in Ukraine, which, though, is very unlikely to yield tangible results. Also, last week, the Minister of Finance reported it sees a significant shortfall in external financing for 2027.
On Friday, Eurobond prices moved up 1.5% on average following confirmation of President Trump representatives’ visit moscow and Kyiv. The comments by the President of Ukraine on Sunday implicitly confirmed the visit brought no tangible results, at least at this stage. The parties have not shared the details of the negotiations so far.
Another noteworthy event last week was the Finance Minister’s statement that the shortfall in funding for the 2027 budget is now estimated at US$32.6bn. However, the minister noted that will not affect external creditors.
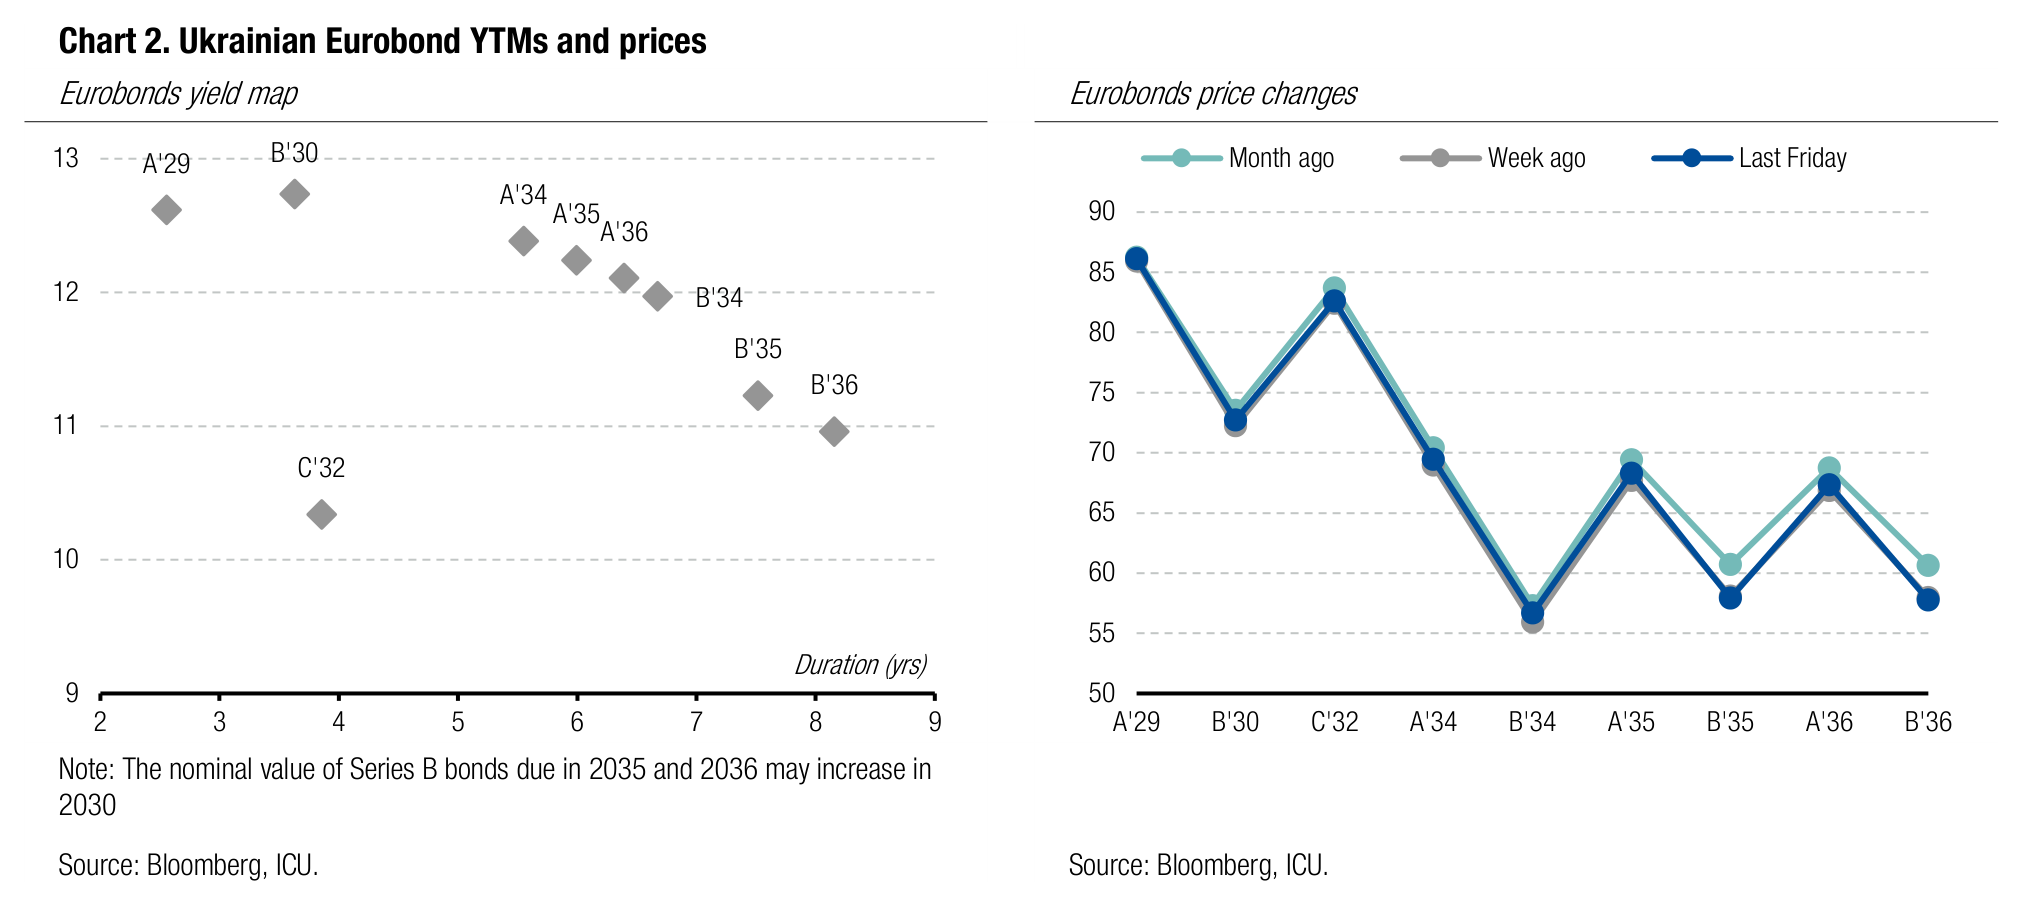
ICU view: The progress (or lack of it) of the US-mediated peace negotiations over the past year has been the key price driver for Ukrainian Eurobonds. Investors tend to overwhelmingly focus on positive aspects of any US efforts to end the war. We continue to believe that the prospects for fruitful peace talks remain illusory, and investors' optimism is not justified. At the same time, restart of negotiations is a positive signal as they remained frozen since March as the US administration focused on Iran war. The significant increase in estimates of Ukraine's financing needs for the next year is unlikely to pose risks to Eurobond holders at this stage. However, investors should be wary of the growing direct and indirect war-related losses of the Ukrainian economy, as well as a significant increase in external financing needs for the coming years.
Foreign exchange market
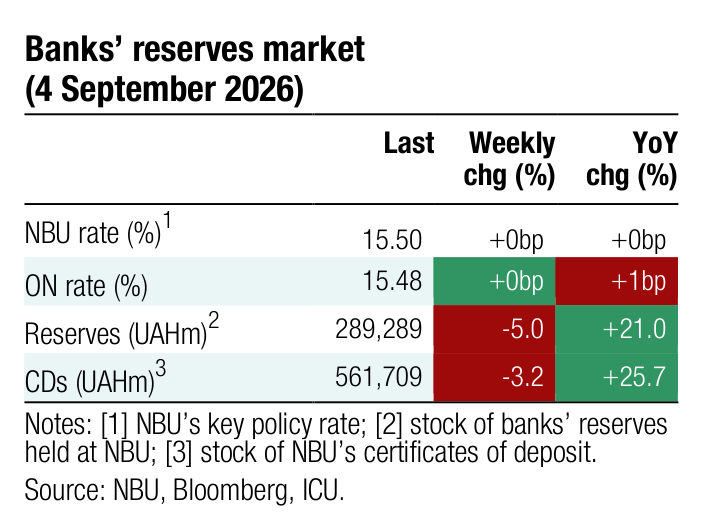
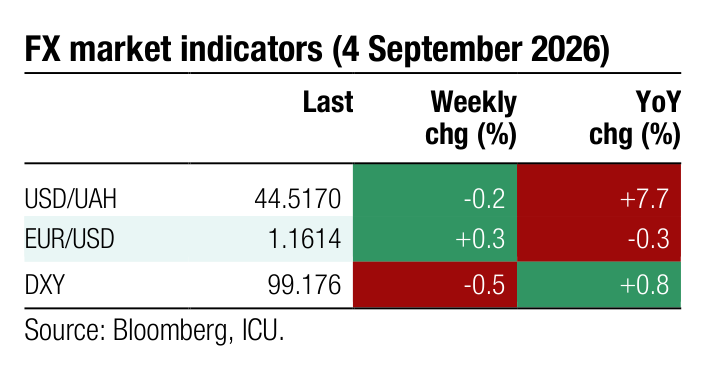
NBU stabilises hryvnia via ample interventions
The National Bank allowed the hryvnia to fluctuate in a narrow range last week, slightly above UAH44.5/US$, while maintaining interventions at near-record levels.
The foreign currency shortage widened further last week, mainly due to the usual increase in household demand for hard currency at the beginning of the month. Net foreign currency purchases in the retail segment almost doubled to US$186m over four business days last week (+90% WoW). The total FX deficit for four business days rose over US$1bn.
Accordingly, the National Bank at times had to increase interventions to almost US$300m per day for a total of over US$1.3bn (+4.5%) for the full week. This kept the official US$/UAH exchange rate nearly unchanged WoW, slightly below UAH44.6/US$
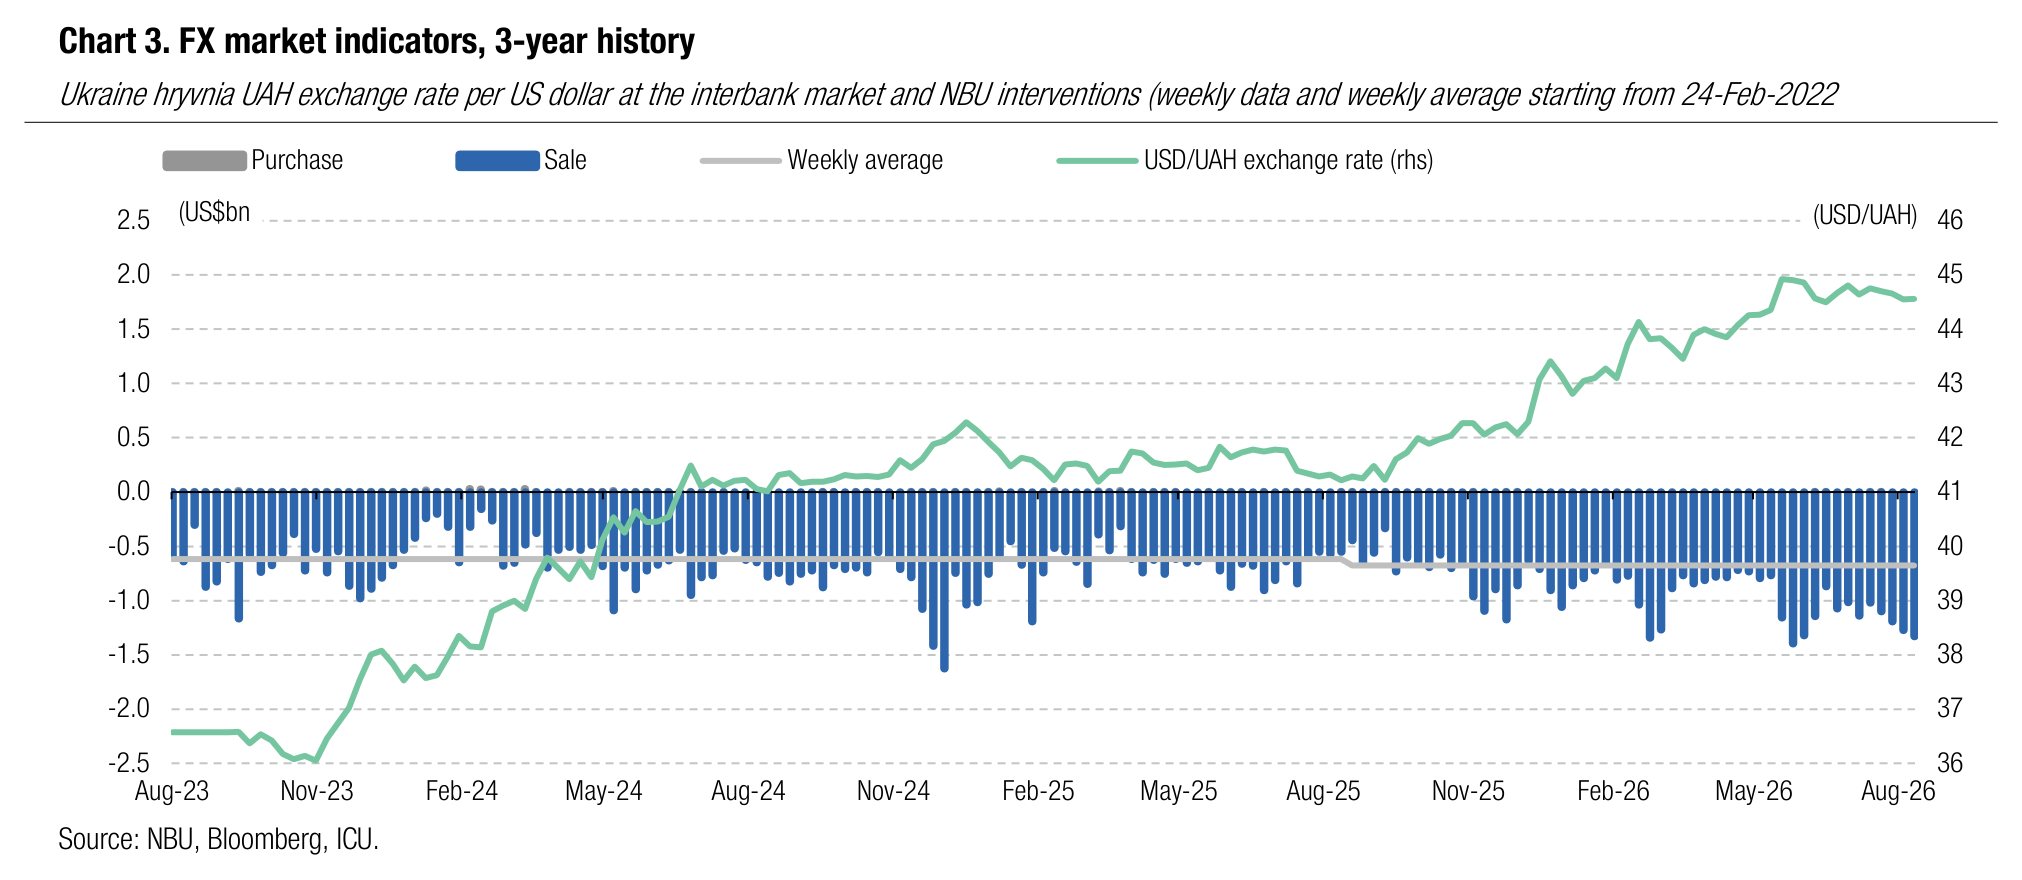
ICU view: The NBU's decision to strengthen the hryvnia over the last few weeks is likely supposed to demonstrate the central bank is prepared to move the exchange rate both ways and that the hryvnia can strengthen occasionally despite a persisting significant market deficit. In our view, the strengthening of the hryvnia is a short-term trend and the rate may return back to UAH45/US$ in the coming weeks. By the end of the year, we see a gradual devaluation of the hryvnia to UAH45.8/US$.
Economics
C/A balance keeps improving on USL loan
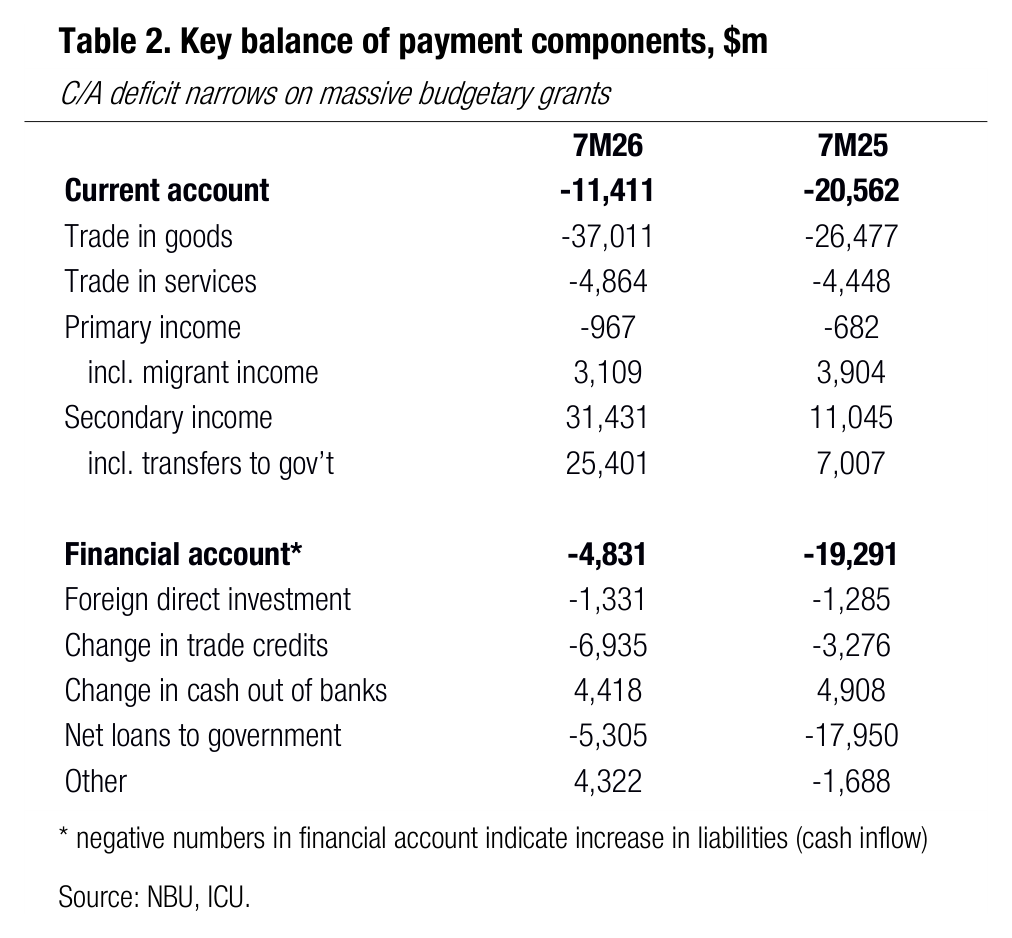
Ukraine’s current account balance was close to zero in July as a growing trade deficit was offset with budgetary grants within USL funding from the EU. Yet, the C/A gap kept widening if budgetary funding is netted out.
The deficit of foreign trade in goods kept widening as the 12-month rolling gap reached US$62bn, an equivalent of 27% of expected 2026 GDP. The economy started to take the pain of logistics bottlenecks caused by russia’s terror attacks on Ukrainian Black Sea ports. Export of goods was down 7% YoY in July (+3% in 7M26) with decline seen across all key commodity groups. Meanwhile, import was up 15% YoY in July (+23% in 7M26) with machinery and equipment (that includes components for local weaponry production) being the key driver. The balances of foreign trade in services and primary income were little changed vs 2025. Yet, the secondary income spiked as the EU funding within Ukraine Support Loan (USL) kept flowing in during July, and that facility was classified as grants in BoP statistics.
The financial account was marginally negative in July but ended with a surplus of US$4.8bn for 7M26. The reduction in the stock of trade credits was the key factor behind the 7m26 surplus. The outflow of FX cash from the banking sector remains the key channel for capital flight, yet its size stabilized at a reasonable average US$0.5bn in the last couple of months.
The combined balance of the current account and financial account was negative in July and 7M26, which led to a reduction in NBU reserves by 0.1% in July and 10.6% YTD.
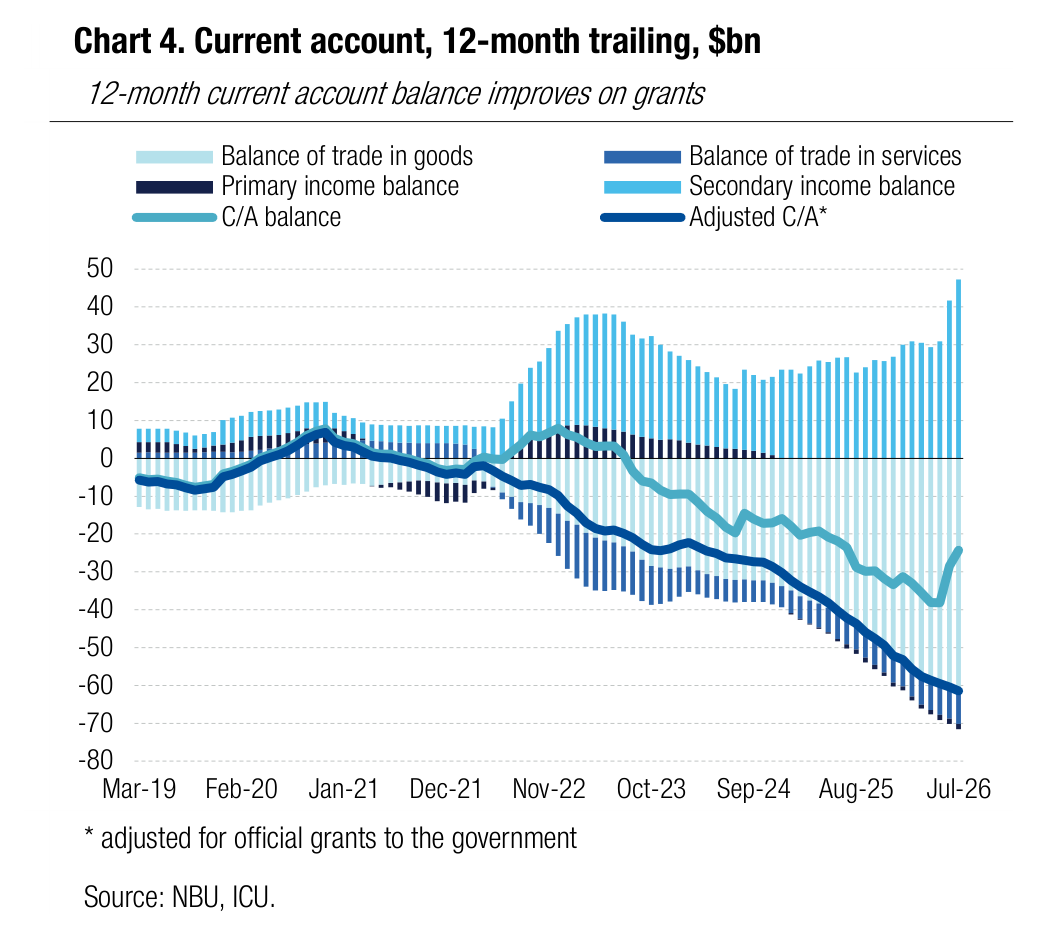
ICU view: July data confirm the worrying trend of growing external imbalances net of foreign financial aid. Noteworthy, the recent foreign trade gap can be partly explained with higher imports of components for domestic production of weaponry that is being funded with the defense component of USL. We continue to expect that the inflows of foreign financial aid will be sufficient to offset the external imbalances and enable the NBU to grow its reserves in 2026 and likely in 2027. Yet, Ukraine will need to secure much more external funding to ensure it is able to maintain macroeconomic stability beyond 2027.